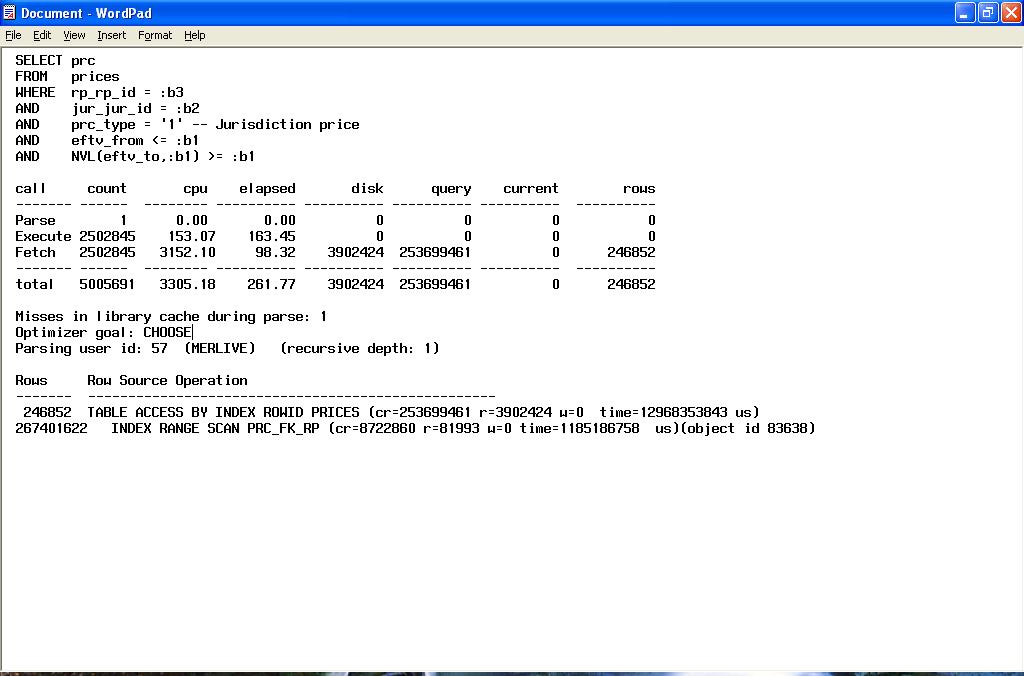
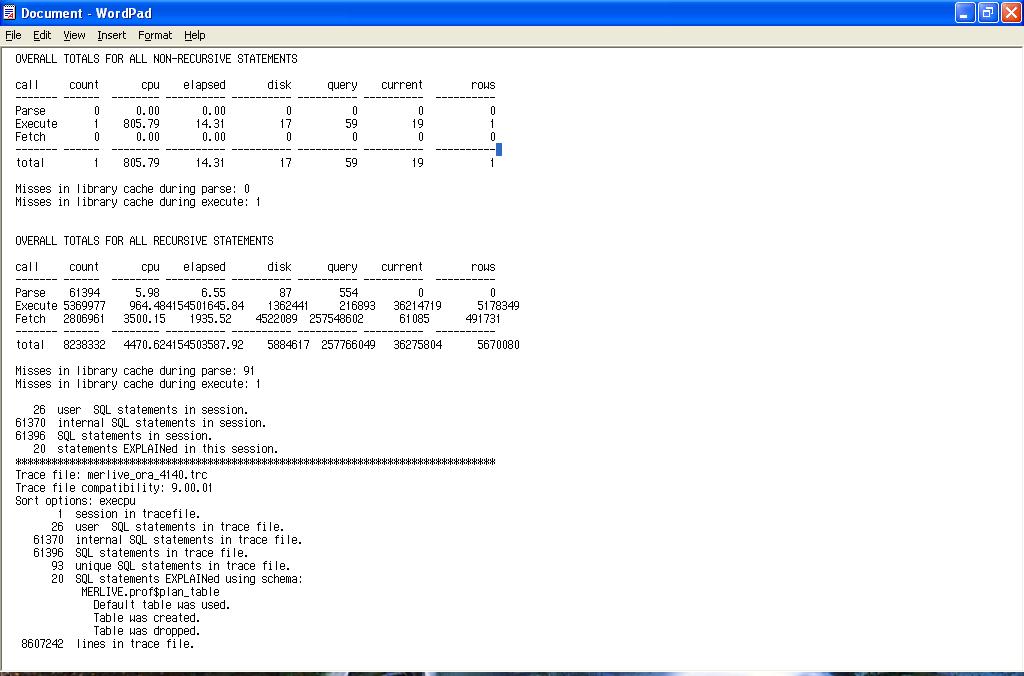
1. 2. 3. 4. 5. 6. 7. 8. 9. 10. 11. 12. 13. 14.

Monday, June 19, 2006

Performance tuning using SQL Trace part 3

Interpretting SQL Trace tkprof output continued . . .

The 'Parse' Line
  • High CPU value
    This is indicative of hard parsing through poor use of bind variables, the shared pool being too small or the use of sequences without caches specified. cursor_sharing in 8i onwards can alleviate this as can the shared pool partitioning available in 9i for multi processor machines, however the optimum solution is to use bind variables. Note that DDL statements, CREATE TABLE , TRUNCATE etc will always force hard parsing, as such these statements are always parsed, executed and then their parsed representations are thrown away. To quote Tom Kyte from Expert Oracle Database Architecture: "If I were to write a book about how to build none scalable Oracle applications, then Don't Use Bind Variables would be the title of the first and last chapters.". Input bind memory allocation size as described in Jonathan Lewis's blog can also be a contributory factor:-

    http://jonathanlewis.wordpress.com/2007/01/05/bind-variables/#more-110

  • High parse elapsed times
    For releases prior to 9.2.0.5.0 this could possible mean that open_cursors is too low, for releases above this session_cached_cursors (which supersedes this) may not be set high enough. This could also indicate contention on the latches protecting the shared pool to excessive hard parsing by other sessions.

The 'Execute' Line

This is where all the work is done for DML statements. Where as for a SELECT this will be empty as the work is performed in the FETCH. Low execute to parse ratios and numerous statements that are only parsed and executed once could point to poor application design. Where possible a statement should be parsed once and executed many times over. There is always an exception to any rule, the exception here being that one statement can do the job of many statements if your application has scope got using the MERGE statement (9i+) and / or bulk binds. The functionality of the MERGE statement is further enhanced in 10g as a MERGE can now perform the full gamut of DML statements, i.e. INSERT, UPDATE and now DELETE. This is further muddied by 10g performing bulk binding "under the covers" for certain cursors.

  • High CPU execute values
    Indicative of poor execution plans, or storage requiring re-organisation, e.g. row chaining migration, poor index clustering factors or indexes with excessive dead space. This will usually be accompanied by large values in the disk and / or query and / or current columns. Your session spinning whilst waiting for a latch can also add to this figure.

  • High CPU wait
    Hints towards waiting on a none CPU resource, IO being the most usual suspect.

  • High disk reads
    For a database used for online transaction processing or high batch throughput this should low, for data warehousing applications achieving a low number of disk reads may not be achievable. Also note that certain parallel operations such as parallel full table scans will by-pass the buffer cache and incur extent check pointing in the process.

  • Query
    This denotes the number of times that the query has to re-construct blocks using undo in order to achieve read consistency. If this is high, ask the question ; are there other session running against the database which are performing needless work, however as Oracle is designed for the multi version-ing of data, a certain amount of block reconstruction from undo is to be expected. However an excessive amount of block re-construction can result from a phenomenon known as 'restart-ing', take for example the following simple UPDATE statement:-

    UPDATE mytab
    SET cola = cola + 1
    WHERE colb = 3

    Before Oracle will update the relevant rows it has retrieved, it will check whether colb has changed from 3 to any other value since the statement started executing. If this is the case, i.e. another statement that was executed before this one committed shortly before this statement was due to finish, the whole statement will be rolled back and re-executed. It is Tom Kyte who has described this event (in much more eloquent detail) in his Expert Oracle Architecture book as a 're-start'.
  • Current
    Total number of buffers retrieved in current mode, this only applies to DML statements, if undo has to be used in order to construct read consistent images of blocks, the final images will be materialized as current bocks.

  • Rows
    The value in this column puts the overall efficiency of the query into context, if the ratio of disk reads + query (consistent gets) + current gets is high compared to the number of rows returned, there may be issues with the physical structure of the objects used (chaining, poor index clustering factors etc) or the statement plan may be 'bad'.
. . . to be continued


Sunday, June 18, 2006

Performance tuning using SQL Trace part 2

All being well your sql trace file file should appear in the user_dump_dest directory, if you SQL was contained in PL/SQL executed on a job queue, this may appear in the bdump directory. In this form it is pretty hard to decipher the information your raw trace file contains. Therefore you are best to using a utility called tkprof, which is essentially a text formatting tool that reads a trace file and generates an output file containing the trace file in a more readable format. tkprof takes various command line parameters, the tkprof command line I use is :-
tkprof tracefile outputfile sys=no sort=execpu explain=schemaname/password

The sys=no filters out recursive SQL, although you might want to include this if you think there is an abnoramlly high recursive overhead associated with your trace or you want to gain some insights into how Oracle works under the covers. With releases from 9i onwards you can add waits=y if you wish to see wait information in the output file.

Your trace file should always be 'tk-profed' against the database the trace generating session ran against, otherwise you might see execution plans which bare no relation to the those used for the statements when the trace file was originally generated. Changes in statistics and the schema (e.g. indexes dropped or added etc.) after the trace has been generated will also skew your execution plans.

The output file contains three sections (click on the screen shots to view them in a larger form) :-
  • Header
    Details the trace file the tkprof output file represents and the sort options tkprof was invoked with.
  • Body section
    This contains statistics for each statement executed, as per the excerpt below :-

  • Trace file summary section

Usually it is the statements that have consumed the largest amounts of execution time that are the causes of poor performance, if your SQL is part of a PL/SQL procedure, function or package you may see something like this at the top of your file :-

begin
myproc;
end;

It is the DML and SELECT statements that should be focussed on. Sometimes it is worth performing a findstr or grep for 'total' in the output file as sometimes you can get statements with abnormally high elapsed times. One example of this was when I encountered TRUNCATES in some PL/SQL running under 8.1.6 which were being throttled by cross instance enqueue waits. However, you should be aware that elapsed time is the sum of time spent waiting across all processors in the database server and considering the trend in CPU design towards multi processor core CPUs, initial impressions of elapsed times may suggest they are superficially high. The use of waits=y when running tkprof will put your elapsed times into a clearer context.

Now to the hardest part, interpretting what you SQL Trace tkprof output infers. In an ideal world a statement should run whilst incurring the smallest number of buffer gets and disk reads as possible without any hard parses. Also the ratio of buffer gets plus disk reads to rows returned, unless your query is a straight aggregate SELECT, e.g. SELECT SUM(col) FROM . . ., or TRUNCATE should be as low as possible. But this all depends on the type of application you are running, for example, if you are trouble shooting a data warehouse, achieving a good buffer or db cache hit ratio may not be achievable. Furthermore, with a data warehouse you would expect parse times, even for hard parsing to be a drop in the ocean compared to the time spent running the parsed statement. Consider a data mining application, by its very nature you might get a low buffer plus disk read to rows returned ratio despite your best tuning efforts.

And this brings me on to a quick word on hit ratios. You should bare in mind that good hit ratios are not a panacea to solving all performance ills, on the oracledba.co.uk web site there is some code available under the tuning section for 'setting' your buffer hit ratio. This is a round about way of proving that database activity which should never take place to begin with can result in a good buffer hit ratio. The upshot of all of this is that the best performance metric is a measure of how quickly the application achieves the operational goals it was designed for, e.g. seat availability lookup in an airline ticket booking system.

But here are some general guide come in part 3 of this article.

Wednesday, June 14, 2006

Performance tuning using SQL Trace part 1

I quite regularly trace PL/SQL stored procedures and packages which run over night,
my preferred method of generating a trace is to put a call to DBMS_SESSION.SET_TRACE(TRUE) at the top of the procedure. You can use DBMS_SYSTEM.SET_EV to set a variety of events for the session or you could use DBMS_SUPPORT if you want to capture bind variable and wait information in your trace file. The 10g documentation also states that DBMS_MONITOR can also be used for this, although I have never used this.

For SQL embedded in a 3 GL I use a logon trigger which gets the sid of the session from v$mystat, looks up the executable the process represents from the program column in v$session and then use calls DBMS_SESSION.SET_SQL_TRACE if the process to be traced has connected. This should only be used to trace processes when a performance issue is evident and the process connects and disconnects from the database so rapidly that tracing the session is not practical using a tool such as TOAD or DBMS_SYSTEM.SET_SQL_TRACE_IN_SESSION.

CREATE OR REPLACE TRIGGER trace_logon
AFTER LOGON ON DATABASE
DECLARE
v_dummy INTEGER;
v_sid INTEGER;
v_ser_hash INTEGER;
BEGIN
SELECT sess.sid,
serial#
INTO v_sid,
v_ser_hash
FROM v$session sess,
v$mystat mys
WHERE sess.sid = mys.sid AND
upper(program) LIKE '%SVMS%';
DBMS_SYSTEM.SET_EV(v_sid,v_ser_hash,10046,12,'');

EXCEPTION
WHEN NO_DATA_FOUND THEN
v_dummy := v_dummy + 1;
END;
/
If you know which schema the process you wish to trace you can change the first two lines of the create trigger statement to :-
create or replace trigger on_logon after logon on

Make sure that timed_statistics is set to true (for releases prior to 8i) at session or instance level and for releases 9i and above statistics_level should be set to typical at the very least, otherwise no timing information will appear in your trace file.

You may wonder what value there is in tracing processes the source code for which is unavailable, the answer is in stored outlines which came along in 8i allowing you to influence the executing plans of statements without having to touch any code. I believe there is some editor for stored outlines that comes in one of the 9i Enterprise Manager packs and the SQL Tuning Advisor in 10g can implement changes to execution plans via stored outlines through Enterprise Manager.

If you are stuck with 8i or without access to any of these tools, you may find this
tip from the www.oracledba.co.uk web site useful, in fact I have used this and can confirm that it does work :-

1. Identify the poorly running SQL via any conventional means (V$SQLAREA etc)

2. Create an outline for this SQL (with no tuning performed)

3. Determine a set of hints to improve the access path of the SQL

4. Create another outline for this new improved SQL.

5. Then swap the outlines by tweaking the OL$HINTS table

UPDATE OUTLN.OL$HINTS
SET OL_NAME='tmp'
WHERE OL_NAME = 'THE_BAD_SQL';

UPDATE OUTLN.OL$HINTS
SET OL_NAME='THE_BAD_SQL'
WHERE OL_NAME = 'THE_NEW_SQL';

UPDATE OUTLN.OL$HINTS
SET OL_NAME='THE_NEW_SQL'
WHERE OL_NAME = 'tmp';

Another useful tip is to set the tracefile_identifer parameter to something meaningful, this will ‘tag’ your trace file with whatever string you set this parameter to. This can be done from within SQL PLUS :-

ALTER SESSION SET tracefile_identifier=’mytrace’

Or you can embed this within PL/SQL :-

EXECUTE IMMEDIATE ‘ALTER SESSION SET tracefile_identifier=’’mytrace’’

Once you have your trace file which will be located in the user_dump_dest directory, you will need to run it through the tkprof utility covered in section 2 of this post.


Thursday, June 01, 2006

You probably don't need RAC . . .

For those who actually think that RAC is new it is actually the latest incarnation of what started out life as Oracle Parallel Server. The achilles heel of Parallel Server was block contention between the instances which the database was mounted across, in that the instances would 'ping' the shared disks in order to maintain data integrity. If an instance required a block that was in the buffer cache of another instance, the block would have to be written to disk before the first instance could read the block into it’s own buffer cache, this was termed 'pinging' in Oracle parlance. Thus Oracle always recommended that applications were portioned across instances so as to minimise pinging.

Where RAC differs from Oracle Parallel Server is that it uses high speed inter connects to 'fuse' the buffer caches of all the instances in the cluster together, deemed "cache fushion". Version one of this technology prevented read/write pinging and this arrived in 8i, the full implementation of this technology came along in 9i and with it Oracle heralded near linear scalability.

However a truism of all architectures is that you never completely eliminate a bottleneck, you merely move it around and although RAC in 9i is a far more scalable product than OPS, the bottleneck is now the memory interconnect. Because of this you still need to partition your data in order to achieve the best scalability by minimising buffer cache inter connect traffic.

Those wacky guys at Miracle AS (www.miracleas.dk - wacky because they are the only Oracle consultancy to have their own micro brewery) have written an excellent paper entitled "You probably don't need RAC", refer to :-

http://www.miracleas.dk/WritingsFromMogens/YouProbablyDontNeedRACUSVersion.pdf

this in turn points to other good sources of reference material.

The main things to be aware of with RAC are it's costs :-

1. You need clustered servers, this in turns require system administrators with clustering expertise, I believe that to receive training from Oracle for RAC running under SUN you need to be a SUN certified cluster administrator which costs thousands of pounds in training. And in general the number and competency of your support staff will need to increase.

2. Because the servers share the same disks you need a half decent SAN.

3. Most sensible organisations will require a test environment, so multiply thes costs by two and then of course you may need a development environment.

4. You need Enterprise Edition for partitioning although I think that you may now get RAC free with 10g Standard Edition.

Consider also availability, some people may claim they want RAC to ensure 24 x 7 availability in the event of server failure, however it is not unheard of that you may require :-

  • Os upgrade patches.
  • Firmware upgrades.
  • Oracle upgrades and patches.
  • Application upgrades and patches.

Interestingly the paper goes on to say that under certain conditions RAC can revert to OPS type behaviour and Tom Kyte states in one of his answers on Ask Tom that RAC can amplify bad scalability. A presentation recently given on the UKOUG circuit used a partitioning scheme using the instance that inserted rows into tables used in the bench mark as part of the partition key via sys_context('userenv', 'instance') and apparently this worked quite well in bench marks, so obviously RAC is not unlike it's predecessor in that careful consideration has to be given to partitioning your data.

Wednesday, May 31, 2006

SQL Server & Oracle

As I've been tasked with giving some SQL Server training at work, it was topical for me to compare SQL Server and Oracle. There are some DBA's who love Oracle and hate SQL Server and there those who love Oracle but hate SQL Server and few people imbetween. Personally, there are times when I want to do something with SQL Server and would love functionality that is only available in Oracle and conversely there are times when I want to do something in Oracle and I'd like something only available in SQL Server. So based on my experience here is a comparison of the database offerings from the Oracle and Microsoft which is by no means exhaustive, with SQL Server I like :-

  • Ease of installation, although with 9i and more so with 10g Oracle has caught up, however there is no concept of having to manage multiple homes on SQL Server as there is in Oracle.
  • Simplicity of creating temporary tables in transact SQL.
  • Ease with which tables can be populated with the output of stored procedures, with Oracle you need to mess around with user defined types.
  • Low storage administration overhead, out of the box all storage management is bit map managed, Oracle did not get this until automatic segment management came along in 9i. Also you by default you do not have to worry about tablespaces or storage clauses. Interesting, Dave Ensor (ubiquotous of the UKOUG circuit) used to mention that he would create all objects in the same tablespace bin some of his databases to disprove myths about fragmentation and the number of extents used by a segment having any affect on performance. This is akin to what you have in SQL Server, each database is stored in one or more datafiles. Ok, so with 10g you get ASM, but with SQL Server there are no undo tablespaces to worry about nor any temporary tablespaces as you use tempdb which comes almost out of the box.
  • Self managing memory, Oracle started down this road with pga_aggregate_target in 9i and the SGA management is simplified in 10g with the introduction of the sga_target parameter, with SQL Server you simply specify one
    memory foot print.
  • Data Transformation Services, this is a free, powerful and easy to use ETL tool that comes
    with SQL Server, in fact some people like it so much that they advocate getting SQL Server, using DTS and chucking away the rest if SQL Server is not your database of choice.

I don't like :-

  • Basic elements of the SQL language are missing from SQL Server 2000, like the MINUS operator.
  • Unwieldy date manipulation, try achieving the same affect as a TRUNC on a date type in SQL Server
  • Lack of tuning tools and utilities, e.g. nothing to compare to the Oracle wait interface no facility to trace individual sessions unless you incorporate code in stored procedures to invoke query profiler, however this is a bit long winded compared to the means available to you in Oracle.
  • SQL Server enterprise manager is primitive compared to out of the box web enabled console you get with 10g.
  • Lack of an interface into the inner workings of the instance, Ok with SQL Server 2005 we do finally get "dynamic management views" but these are not as mature as Oracles v$ views and fixed tables. Generating execution plans on queries against v$ views can give great insights into how Oracle works under the covers and the likes of Jonathan Lewis and Guy Harrison have written papers on using these fixed views directly and tuning queries running against these v$ and x$ objects.

The last word could go down to platform support, in that every ten years the popular server platform shifts; in the seventies the mainframe reigned supreme, then UNIX came along in the eighties and Windows in the nineties and it now appears Linux is comming to power which would leave SQL Server high and dry.

 
1. 2.