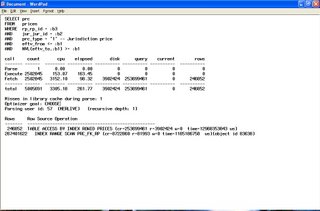
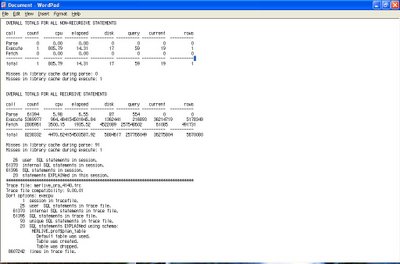
The sys=no filters out recursive SQL, although you might want to include this if you think there is an abnoramlly high recursive overhead associated with your trace or you want to gain some insights into how Oracle works under the covers. With releases from 9i onwards you can add waits=y if you wish to see wait information in the output file.
The output file contains three sections (click on the screen shots to view them in a larger form) :-
- Header
Details the trace file the tkprof output file represents and the sort options tkprof was invoked with. - Body section
This contains statistics for each statement executed, as per the excerpt below :-

- Trace file summary section

Usually it is the statements that have consumed the largest amounts of execution time that are the causes of poor performance, if your SQL is part of a PL/SQL procedure, function or package you may see something like this at the top of your file :-
begin
myproc;
end;
It is the DML and SELECT statements that should be focussed on. Sometimes it is worth performing a findstr or grep for 'total' in the output file as sometimes you can get statements with abnormally high elapsed times. One example of this was when I encountered TRUNCATES in some PL/SQL running under 8.1.6 which were being throttled by cross instance enqueue waits. However, you should be aware that elapsed time is the sum of time spent waiting across all processors in the database server and considering the trend in CPU design towards multi processor core CPUs, initial impressions of elapsed times may suggest they are superficially high. The use of waits=y when running tkprof will put your elapsed times into a clearer context.
Now to the hardest part, interpretting what you SQL Trace tkprof output infers. In an ideal world a statement should run whilst incurring the smallest number of buffer gets and disk reads as possible without any hard parses. Also the ratio of buffer gets plus disk reads to rows returned, unless your query is a straight aggregate SELECT, e.g. SELECT SUM(col) FROM . . ., or TRUNCATE should be as low as possible. But this all depends on the type of application you are running, for example, if you are trouble shooting a data warehouse, achieving a good buffer or db cache hit ratio may not be achievable. Furthermore, with a data warehouse you would expect parse times, even for hard parsing to be a drop in the ocean compared to the time spent running the parsed statement. Consider a data mining application, by its very nature you might get a low buffer plus disk read to rows returned ratio despite your best tuning efforts.
And this brings me on to a quick word on hit ratios. You should bare in mind that good hit ratios are not a panacea to solving all performance ills, on the oracledba.co.uk web site there is some code available under the tuning section for 'setting' your buffer hit ratio. This is a round about way of proving that database activity which should never take place to begin with can result in a good buffer hit ratio. The upshot of all of this is that the best performance metric is a measure of how quickly the application achieves the operational goals it was designed for, e.g. seat availability lookup in an airline ticket booking system.
But here are some general guide come in part 3 of this article.

No comments:
Post a Comment